
我这边私有云集群一直没有一个像样的监控系统,以至于我现在迫切的想整个私有云监控系统,然后就有这次的笔记。
本监控系统基于TenSuns+Grafana+Prometheus探针实现监控并且都基于容器实现。(TenSuns项目地址:https://github.com/starsliao/TenSunS)
本章要用的资源包在这:http://cloud.xpled.icu/alist_share/%E5%AE%9E%E8%AE%AD%E5%AE%A4%20TenSuns%2BGrafana%2BPrometheus%E6%8E%A2%E9%92%88%20%E6%90%AD%E5%BB%BA%E7%A7%81%E6%9C%89%E4%BA%91%E7%9B%91%E6%8E%A7%E7%B3%BB%E7%BB%9F%E8%B5%84%E6%BA%90%E5%8C%85
1、首先部署TenSuns
# 这里用1.1的版本进行演示
[root@docker ~]# wget https://github.com/starsliao/TenSunS/archive/refs/tags/1.1.0.tar.gz
[root@docker ~]# tar zxvf TenSunS-1.1.0.tar.gz
# 配置docker-compose,配置docker环境可以参考我另一篇文章
[root@docker ~]# wget -O /usr/local/bin/docker-compose https://github.com/docker/compose/releases/download/v2.32.0/docker-compose-linux-x86_64
[root@docker ~]# chmod +x /usr/local/bin/docker-compose
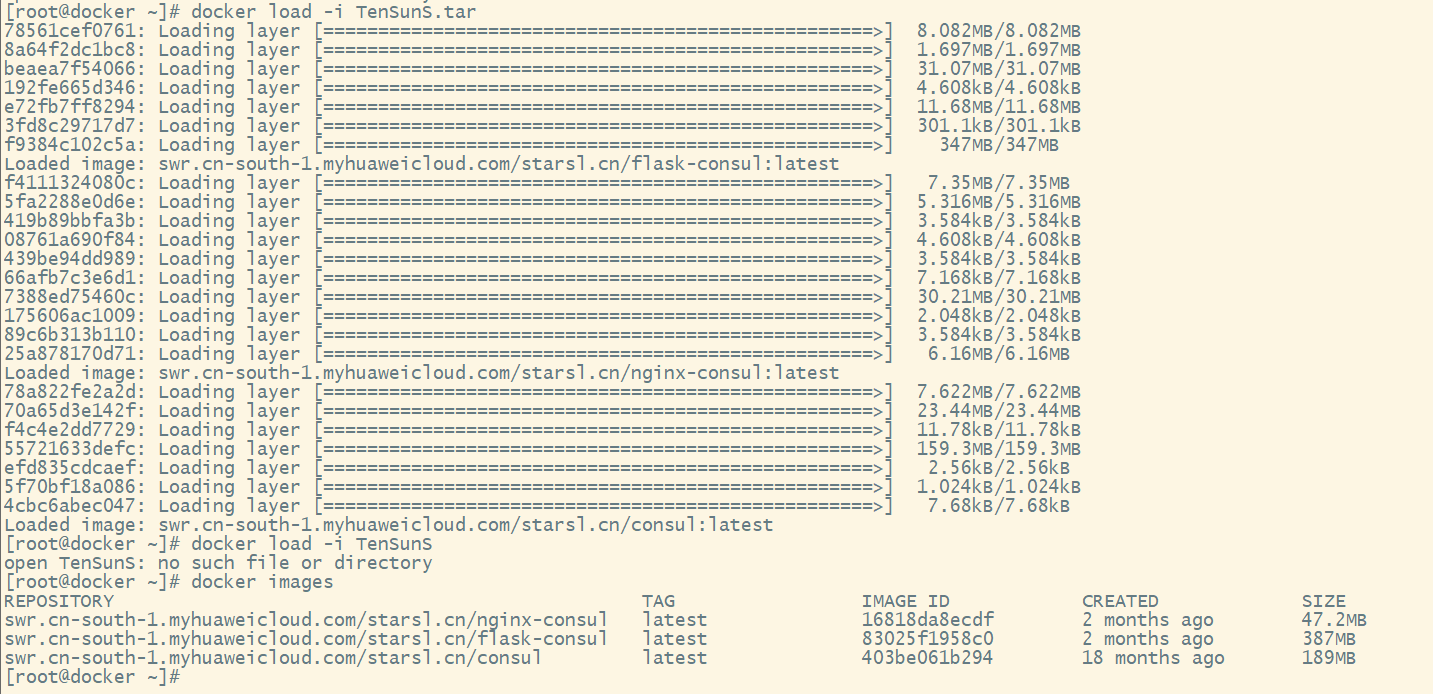
# 导入镜像,因为docker镜像缘故,我这是另一台机子下好传进来的
[root@docker ~]# docker load -i CentOS_7.9.2009.tar
[root@docker ~]# docker load -i TenSunS.tar
# 记得开启v4路由转发
[root@docker ~]# echo "net.ipv4.ip_forward = 1" >> /etc/sysctl.conf
[root@docker ~]# sysctl -f
[root@docker ~]# cd TenSunS-1.1.0
[root@docker TenSunS-1.1.0]# ./install/docker-compose/all_install.sh
正在启动后羿运维平台...
WARN[0000] /opt/tensuns/docker-compose.yaml: the attribute `version` is obsolete, it will be ignored, please remove it to avoid potential confusion
[+] Running 3/3
✔ Container consul Started 0.7s
✔ Container flask-consul Started 1.1s
✔ Container nginx-consul Started 1.7s
后羿运维平台默认的admin密码是:6b496117
修改密码请编辑 /opt/tensuns/docker-compose.yaml 查找并修改变量 admin_passwd 的值
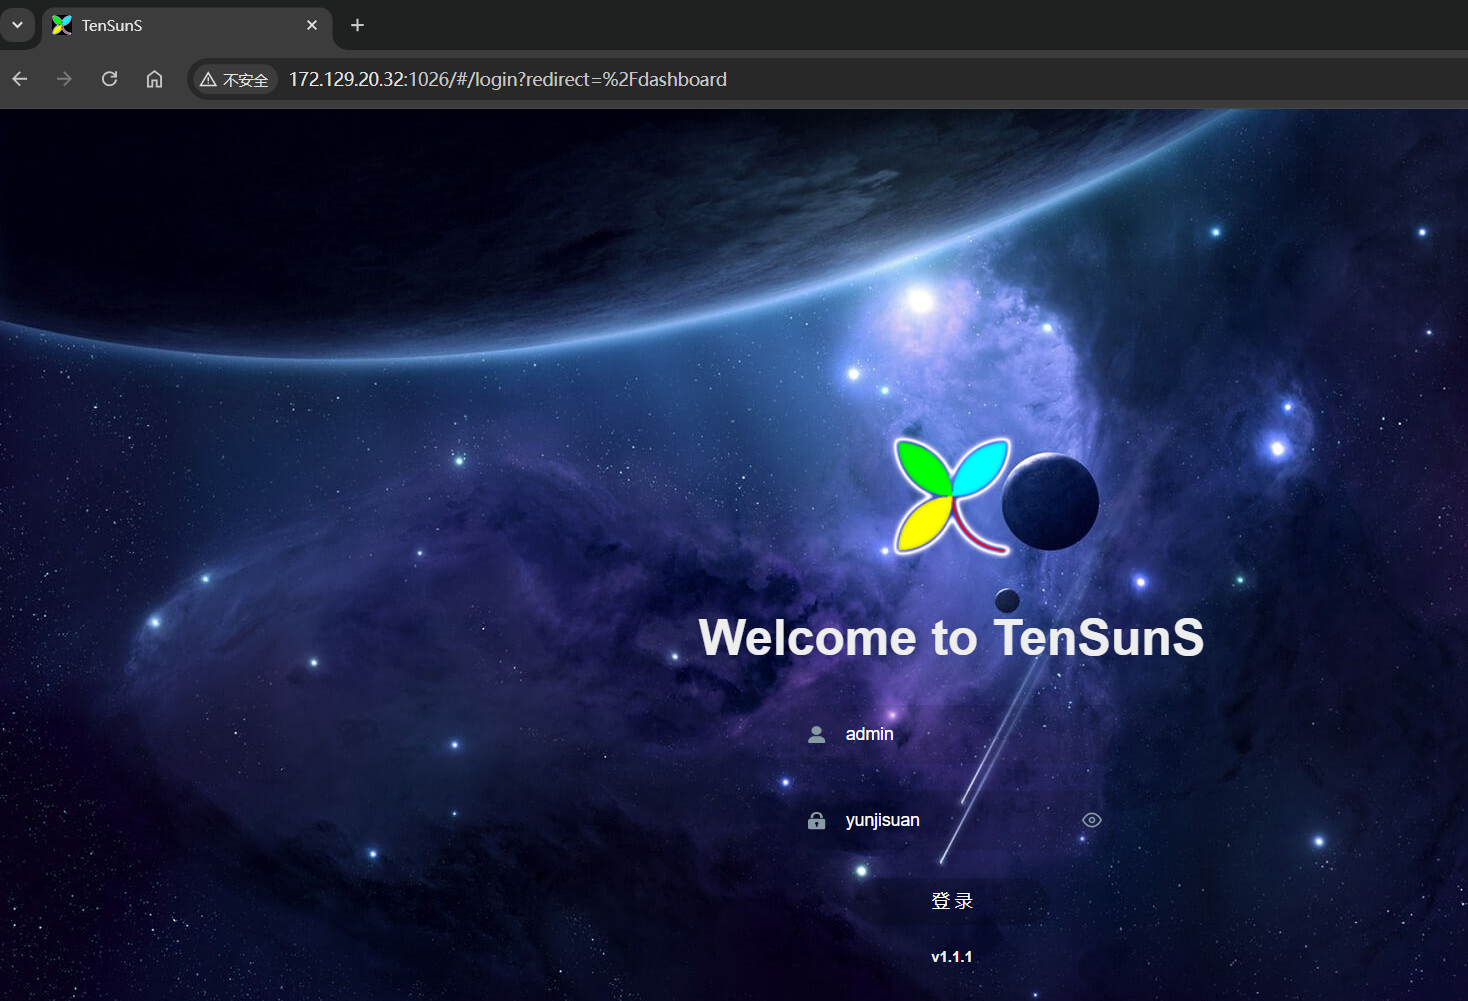
请使用浏览器访问 http://{你的IP}:1026 并登录使用
http://172.129.20.32:1026
## 后面就能访问web界面了,访问后可以修改登录密码,过程如下(切记修改完后要重新up一次不然密码不生效)
[root@docker TenSunS-1.1.0]# cd /opt/tensuns/
[root@docker tensuns]# sed -i 's/默认的admin密码/新密码/' docker-compose.yaml
[root@docker tensuns]# docker-compose up -d
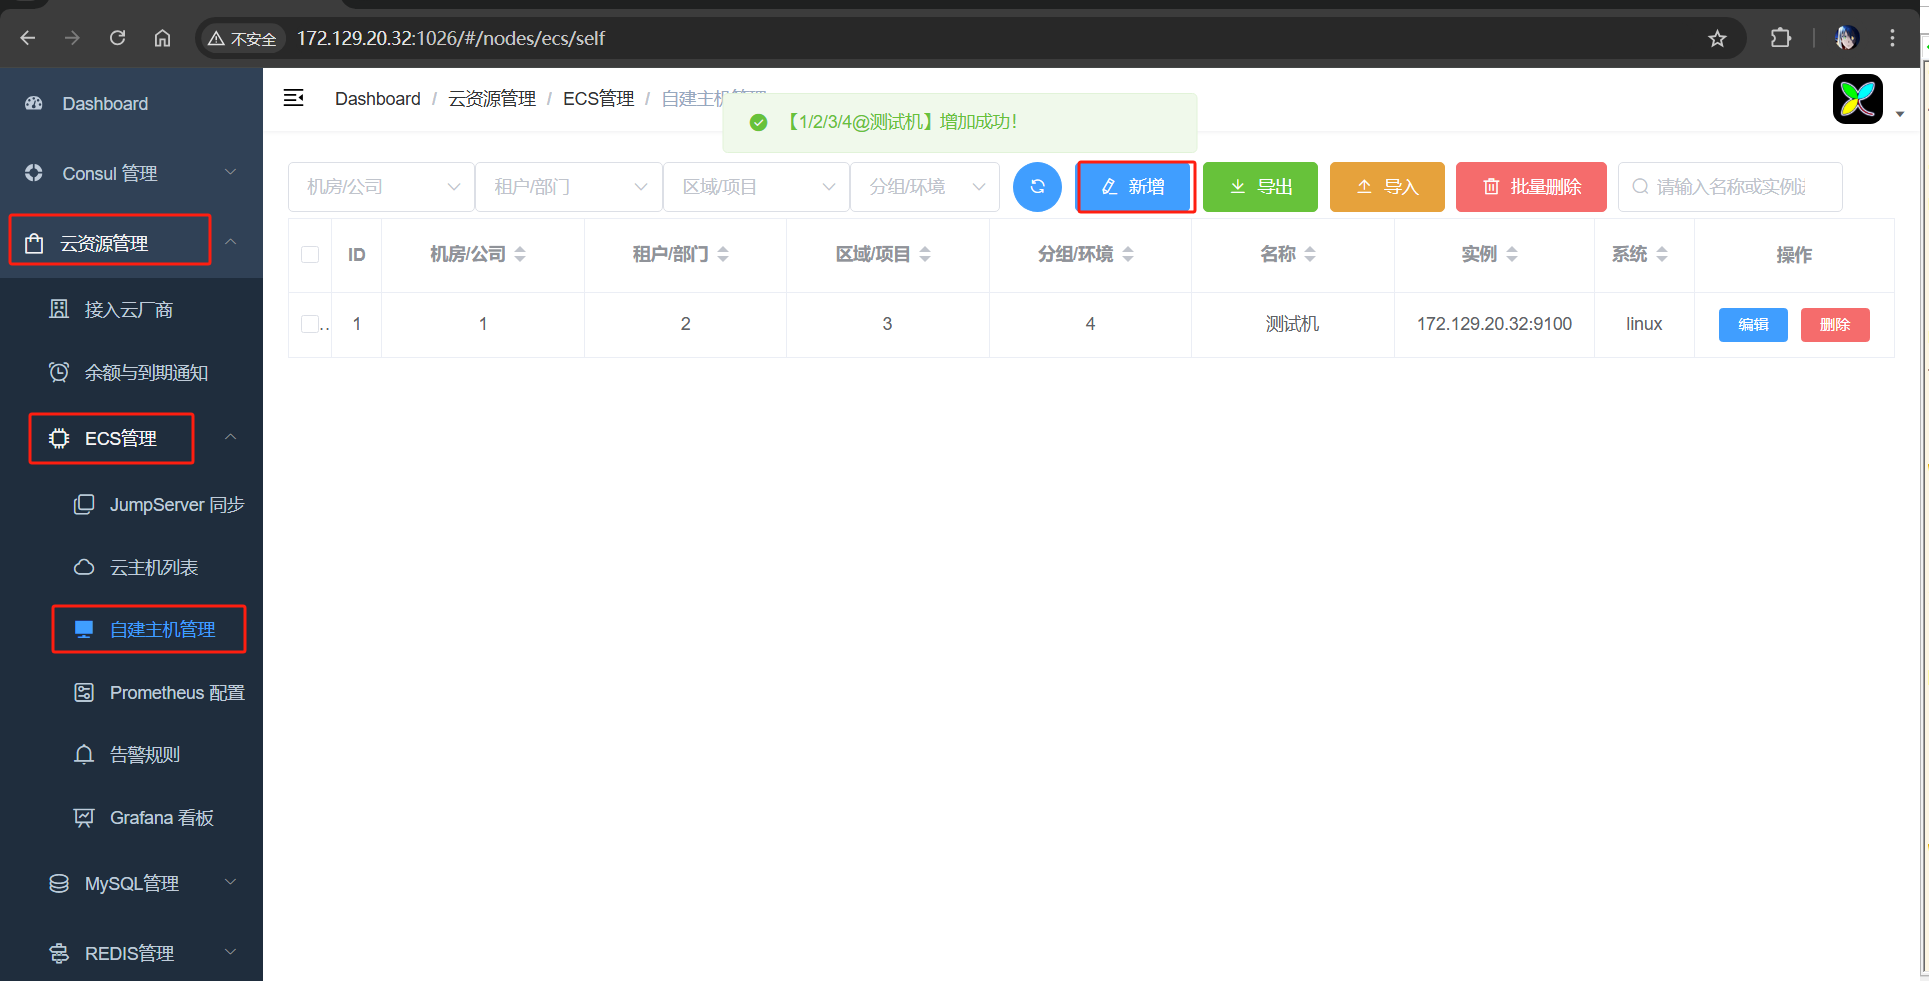
2、在web管理面板上新加主机并,然后配置Grafana还有Prometheus探针
在这里我们可以先添加一个实例进行后续测试,9100是探针的地址,后面我们会创建,稍安勿躁
接下来,我们点击左边的Prometheus 配置,我们要用它的配置进行监控部署
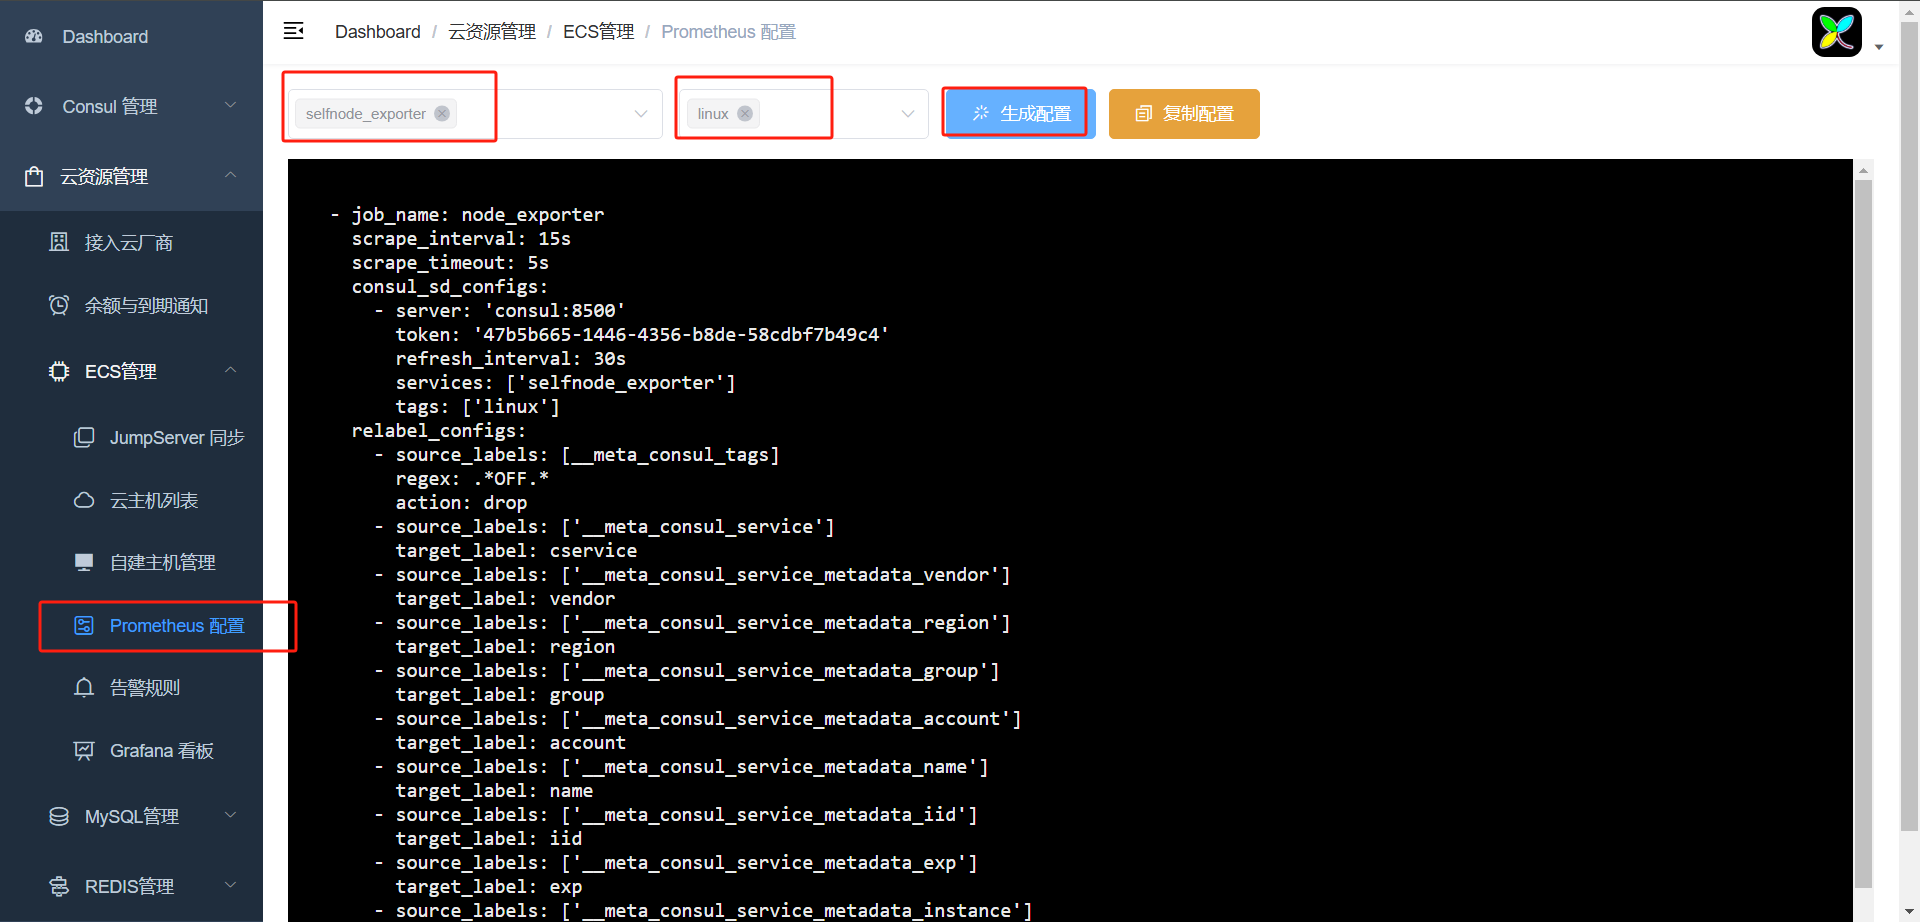
复制完后我们可以先编写prometheus.yml的配置文件,然后就可以进行Grafana和Prometheus探针的部署了
# prometheus镜像构建
[root@docker ~]# vim prometheus.yml
# my global config
global:
  scrape_interval: 15s # Set the scrape interval to every 15 seconds. Default is every 1 minute.
  evaluation_interval: 15s # Evaluate rules every 15 seconds. The default is every 1 minute.
  # scrape_timeout is set to the global default (10s).

# Alertmanager configuration
alerting:
  alertmanagers:
  - static_configs:
    - targets:
      # - alertmanager:9093
# Load rules once and periodically evaluate them according to the global 'evaluation_interval'.
rule_files:
  # - "first_rules.yml"
  # - "second_rules.yml"

# A scrape configuration containing exactly one endpoint to scrape:
# # Here it's Prometheus itself.
scrape_configs:
  - job_name: node_exporter
    scrape_interval: 15s
    scrape_timeout: 5s
    consul_sd_configs:
      - server: 'consul:8500'
        token: '8fb7beb3-5c50-432b-ac0b-30192c6b05b1'
        refresh_interval: 30s
        services: ['selfnode_exporter']
        tags: ['linux']
    relabel_configs:
      - source_labels: [__meta_consul_tags]
        regex: .*OFF.*
        action: drop
      - source_labels: ['__meta_consul_service']
        target_label: cservice
      - source_labels: ['__meta_consul_service_metadata_vendor']
        target_label: vendor
      - source_labels: ['__meta_consul_service_metadata_region']
        target_label: region
      - source_labels: ['__meta_consul_service_metadata_group']
        target_label: group
      - source_labels: ['__meta_consul_service_metadata_account']
        target_label: account
      - source_labels: ['__meta_consul_service_metadata_name']
        target_label: name
      - source_labels: ['__meta_consul_service_metadata_iid']
        target_label: iid
      - source_labels: ['__meta_consul_service_metadata_exp']
        target_label: exp
      - source_labels: ['__meta_consul_service_metadata_instance']
        target_label: instance
      - source_labels: [instance]
        target_label: __address__

[root@docker ~]# vim Dockerfile-prometheus
FROM centos:centos7.9.2009
ADD prometheus-2.55.0-rc.1.linux-amd64.tar.gz /usr/local/bin
WORKDIR /usr/local/bin/prometheus-2.55.0-rc.1.linux-amd64
RUN mkdir -p /data/prometheus
COPY prometheus.yml /data/prometheus
EXPOSE 9090
CMD ["./prometheus", "--config.file=/data/prometheus/prometheus.yml"]
[root@docker ~]# docker build -t prometheus:v2.55 -f Dockerfile-prometheus .
# Grafana镜像构建
[root@docker ~]# cat Dockerfile-grafana
FROM centos:centos7.9.2009
ADD grafana-enterprise-11.4.0.linux-amd64.tar.gz /usr/local/bin
EXPOSE 3000
WORKDIR /usr/local/bin/grafana-v11.4.0/bin
ENTRYPOINT ["./grafana-server"]
[root@docker ~]# docker build -t grafana:v11.4 -f Dockerfile-grafana .
# exporter探针镜像构建
[root@docker ~]# cat Dockerfile-exporter
FROM centos:centos7.9.2009
WORKDIR /root/
ADD node_exporter-1.8.2.linux-amd64.tar.gz /root/
RUN mv /root/node_exporter-1.8.2.linux-amd64/* /usr/local/bin/
EXPOSE 9100
ENTRYPOINT  ["node_exporter"]
[root@docker ~]# docker build -t exporter:v1.8 -f Dockerfile-exporter .
# 编写docker-compose一键启动,被监控机只需要运行探针就可以了
[root@docker ~]# vim docker-compose.yaml
services:
  node-exporter:
    image: exporter:v1.8
    restart: always
    container_name: exporter
    ports:
    - "9100:9100"
    networks:
      - TenSunS
  node-grafana:
    image: grafana:v11.4
    restart: always
    container_name: grafana
    ports:
    - "3000:3000"
    depends_on:
    - node-prometheus
    networks:
      - TenSunS
  node-prometheus:
    image: prometheus:v2.55
    restart: always
    container_name: prometheus
    ports:
    - "9090:9090"
    networks:
      - TenSunS
networks:
  TenSunS:
    name: TenSunS
    driver: bridge
    ipam:
      driver: default
[root@docker ~]# docker-compose up -d
WARN[0000] a network with name TenSunS exists but was not created for project "root".
Set `external: true` to use an existing network
[+] Running 3/3
 ✔ Container prometheus  Started                   0.7s
 ✔ Container exporter    Started                   0.7s
 ✔ Container grafana     Started                   1.3s
访问Grafana+Prometheus探针
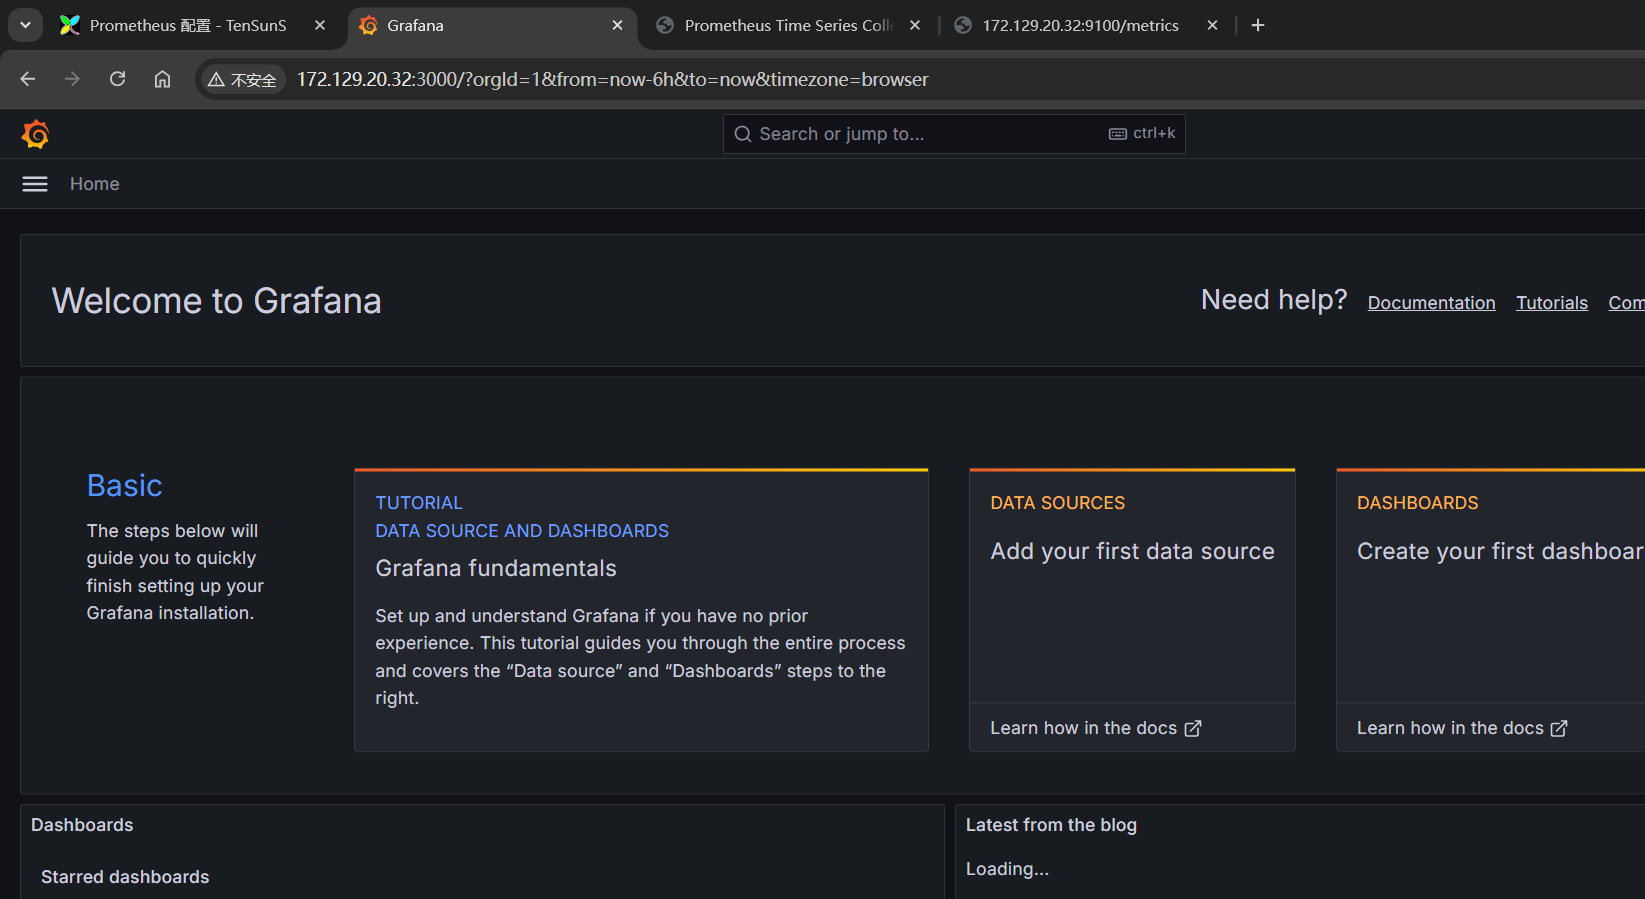
Grafana地址:http://172.129.20.32:3000(初始用户密码均为admin,成功登录会让你修改密码)
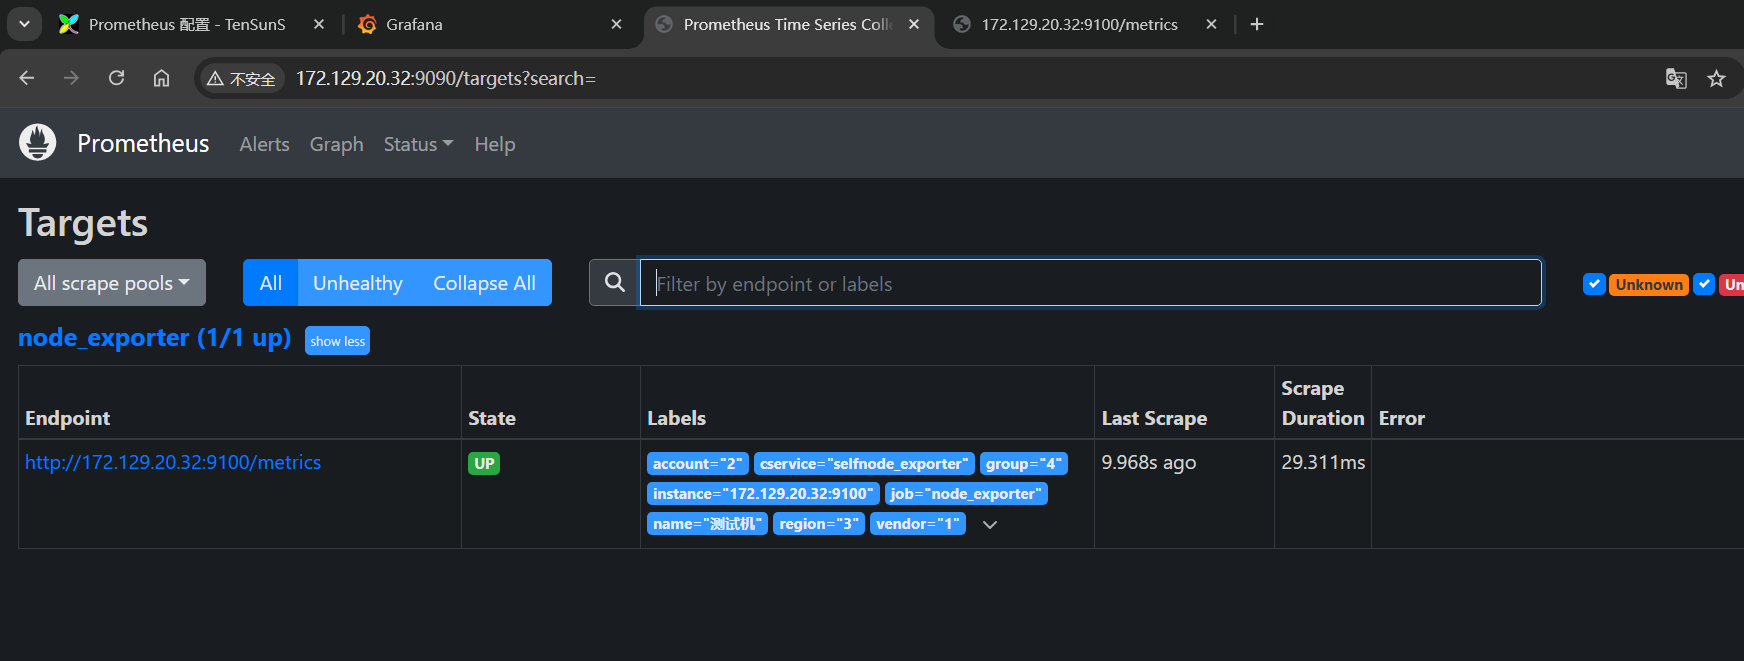
Prometheus地址:http://172.129.20.32:9090
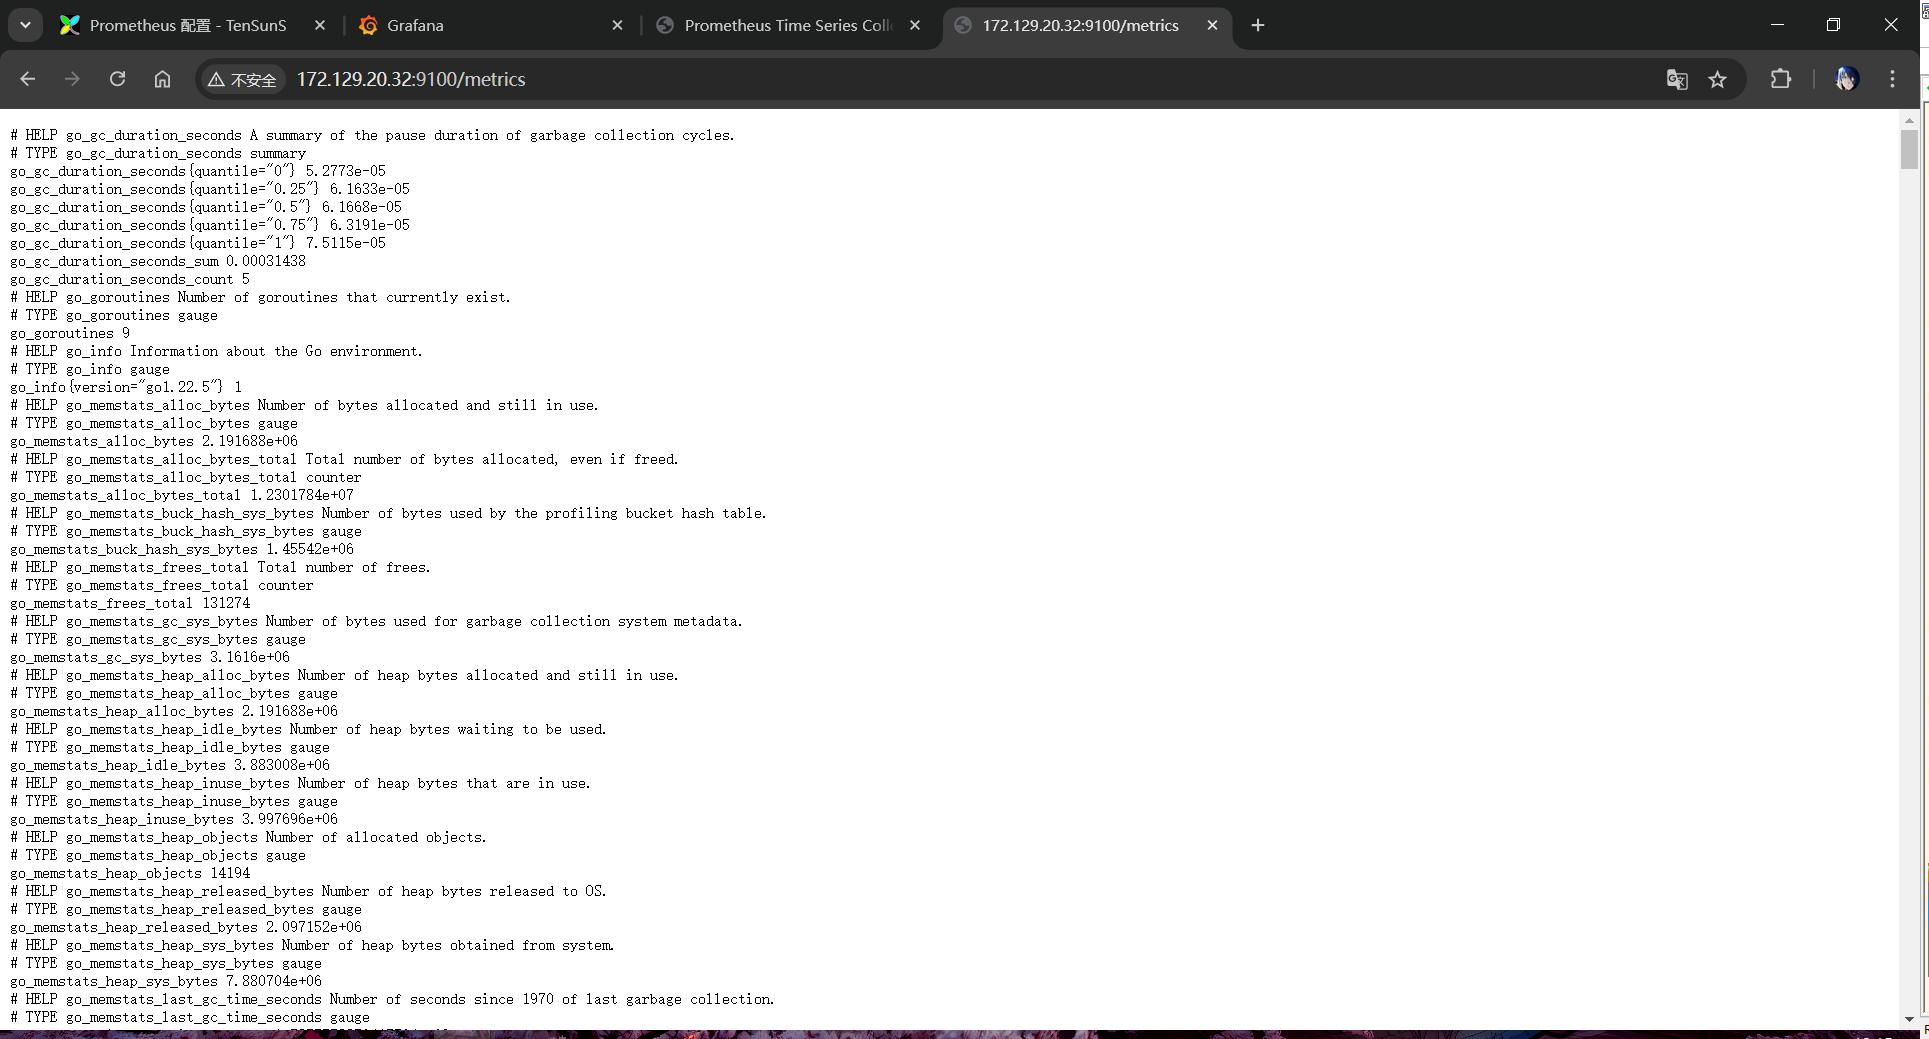
探针地址:http://172.129.20.32:9100
成功如下
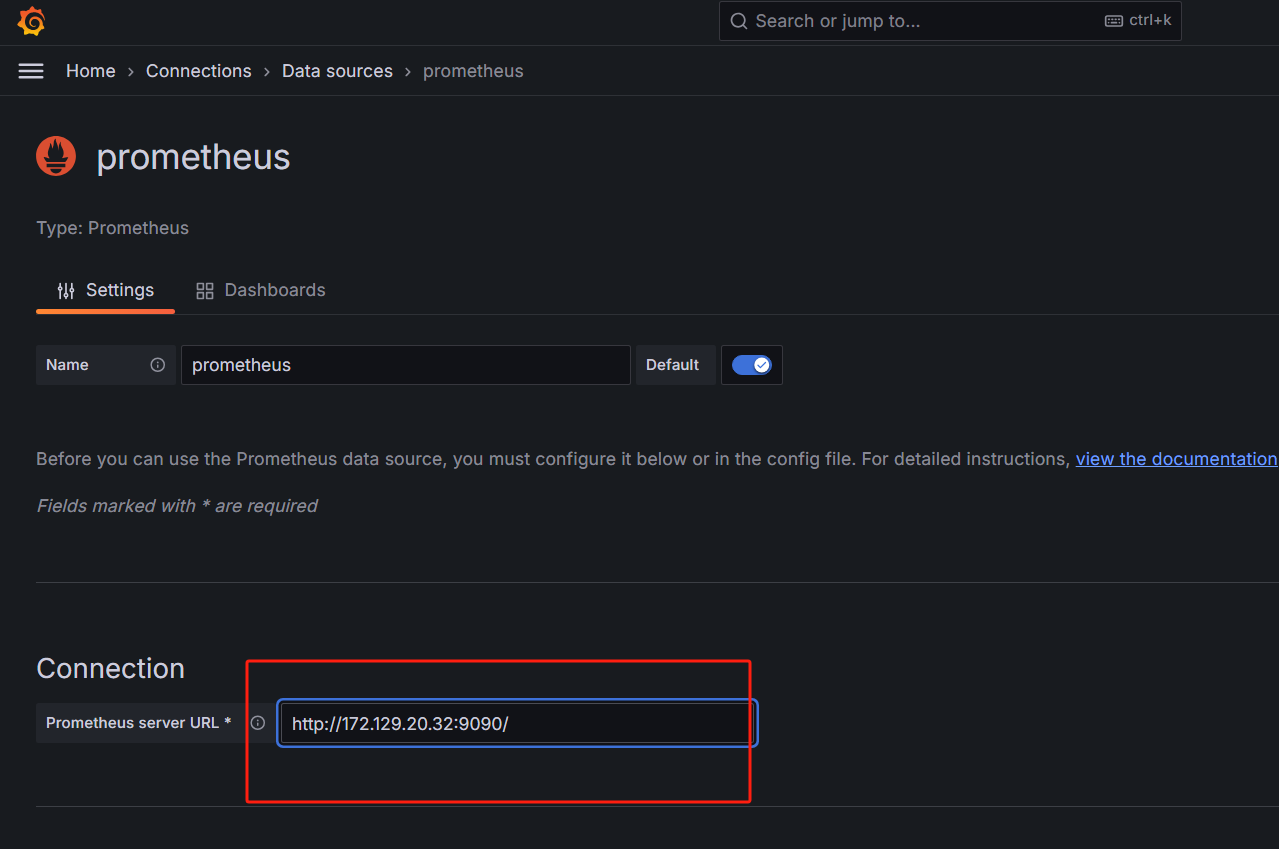
3、接着我们就要配置数据源和监控面板。
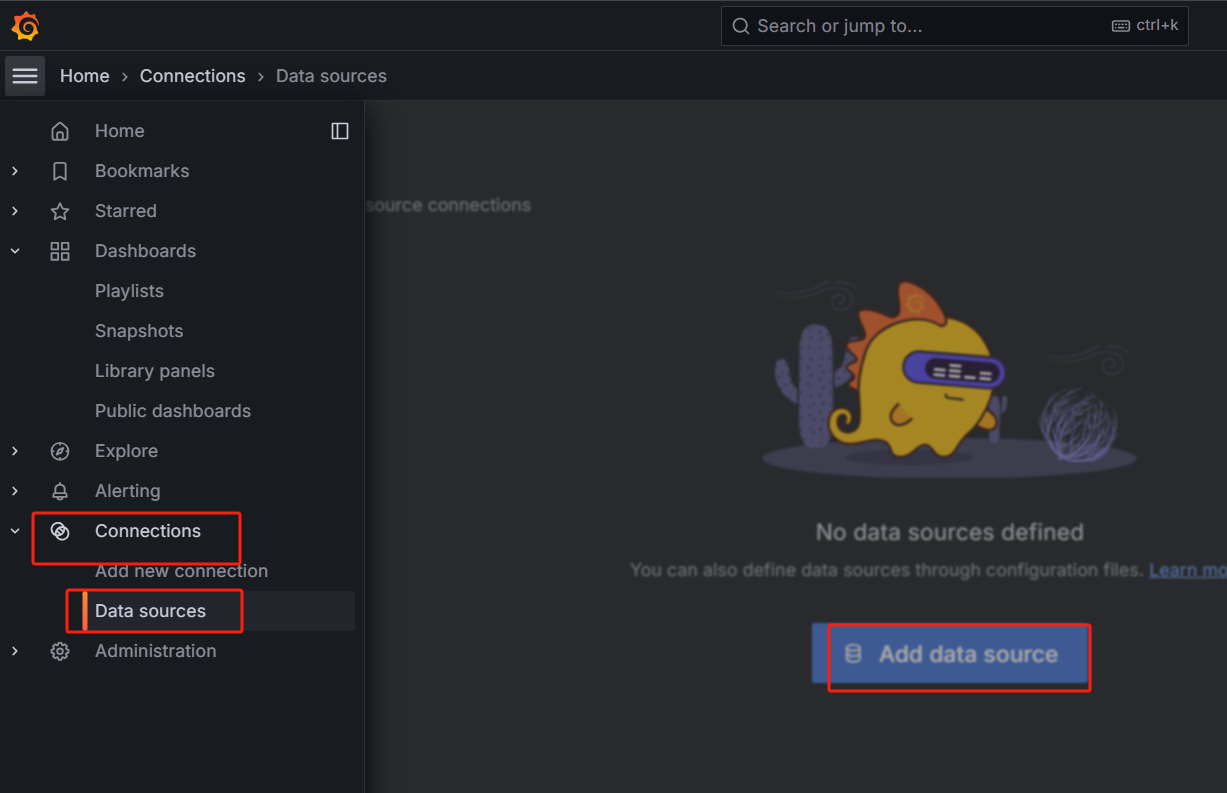
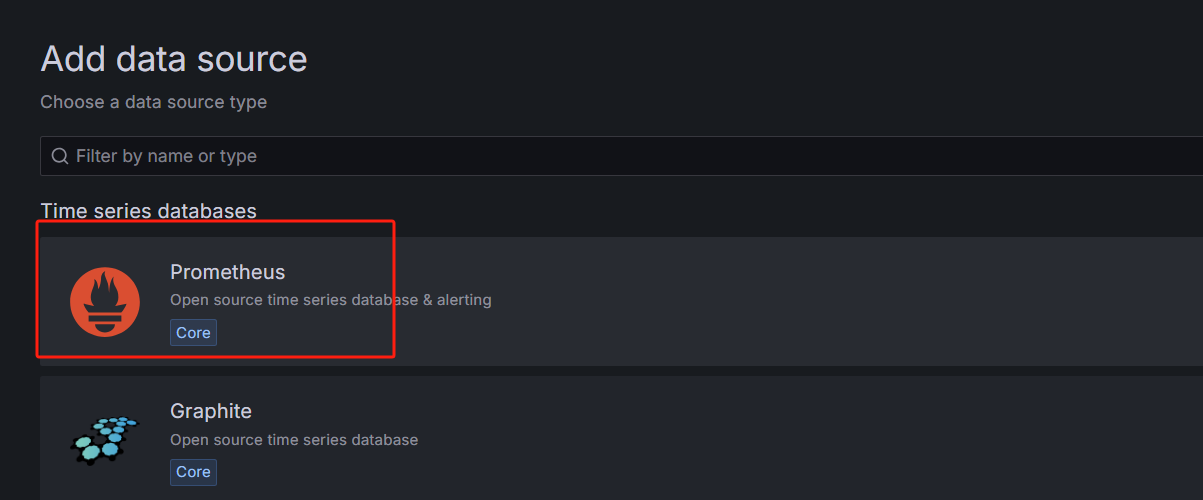
这里填写我们Prometheus的地址
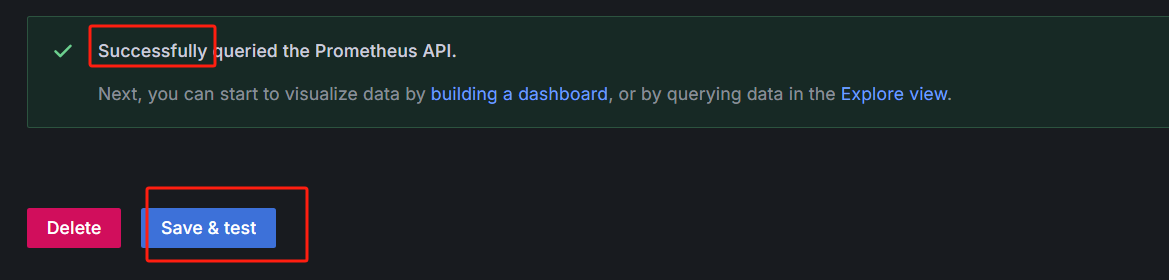
点击save & test 会检测是否有效
接着我们导入面板,因为离线我们要下载好json配置文件(选其一就行)
TenSunS自动同步版:https://grafana.com/grafana/dashboards/8919
通用Job分组版:https://grafana.com/grafana/dashboards/16098
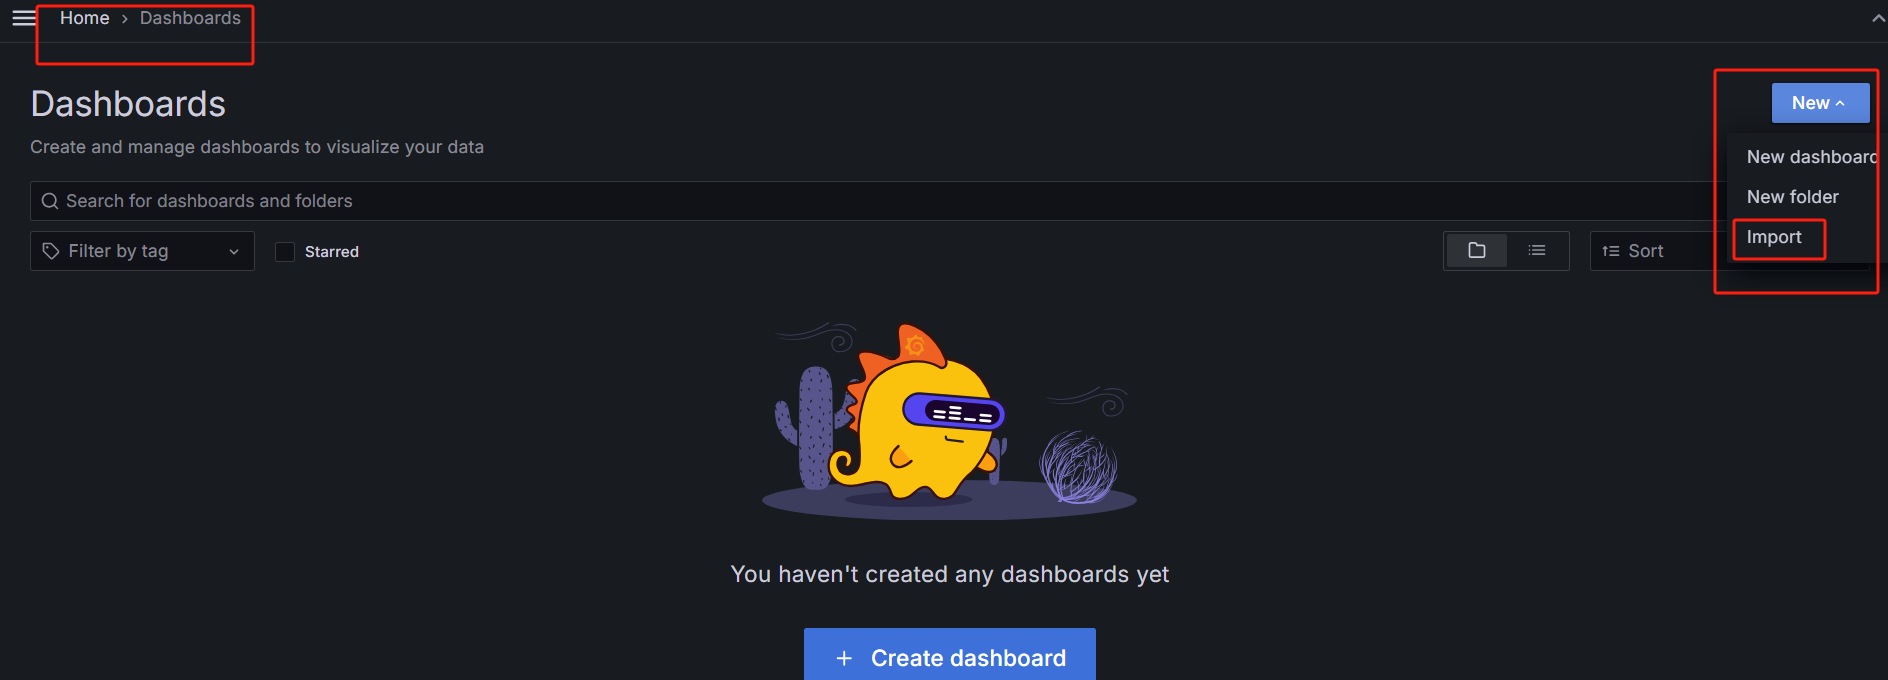
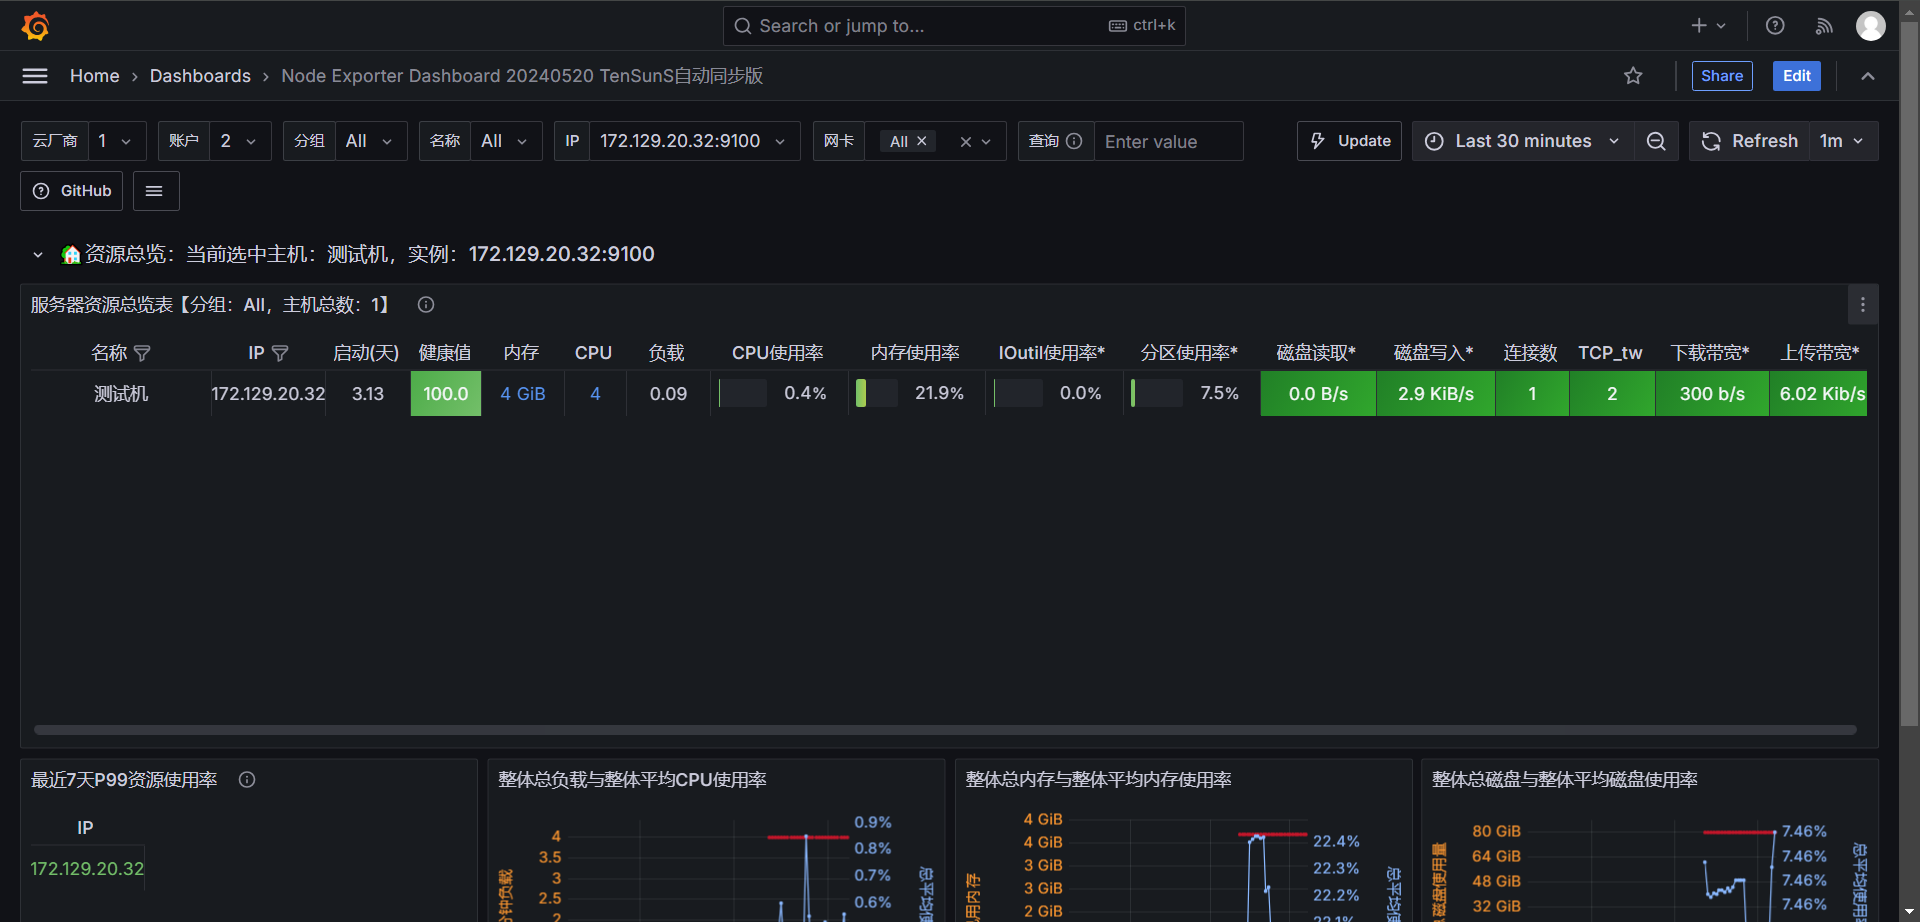
通过导入面板的形式并选择数据源Prometheus后就可以Import了
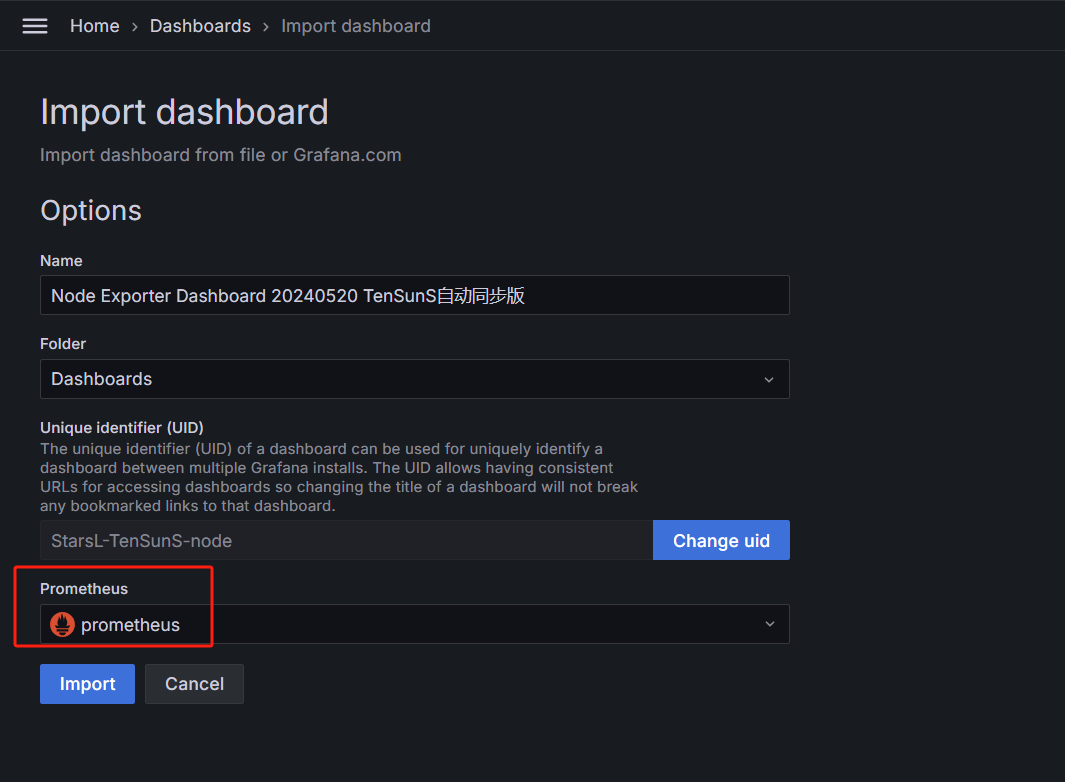
成功如下图
Ps: